


Most measurement advice written for studios was quietly built for high-volume operations. It assumes you have enough bookings each week to see a statistically clean signal, enough new students to A/B test landing copy, and enough staff to sit around debating dashboards. Then a 90-member neighborhood studio tries to apply the same logic and ends up chasing noise — celebrating a "12% jump" in retention that was really just three regulars coming back from vacation.
The core problem with studio KPI governance at low volume isn't that owners track the wrong things. It's that they treat every wiggle in the numbers as meaningful, run experiments that could never detect a real effect, and make decisions on weeks that were always going to be random. Governance, in this context, isn't about tracking more. It's about knowing which numbers deserve a reaction, which experiments are worth running given your traffic, and when you're allowed to conclude anything at all.
This piece is about building that discipline into the actual rhythm of running a studio — a KPI map that separates the metrics you can steer from the ones you can only observe, acceptance criteria for experiments that respect your real volume, and a 12-week cadence tied to things you already do every week.
The two-layer KPI map: what you steer vs. what you wait on
The single biggest governance mistake at low volume is mixing leading and lagging metrics in the same conversation. When a studio owner looks at monthly revenue and this week's class fill rate on the same screen and reacts to both with equal urgency, the fast-moving metric gets ignored and the slow-moving one gets over-managed.
Leading indicators move within days and your actions directly influence them — new intro bookings, trial-to-second-visit conversion, class fill on your marginal (not your packed) slots, waitlist depth. These are your steering wheel. They're noisy, but they respond quickly, which means an experiment can actually show you something inside a few weeks. Lagging indicators are the outcomes those leading metrics eventually produce — monthly recurring revenue, member retention at 90 days, lifetime value, average revenue per active member. These move slowly and are heavily influenced by decisions you made two or three months ago. You don't "fix" a lagging metric this week. You watch it to confirm that your leading-metric bets actually paid off.
| Layer | Metric | How fast it moves | What it's for |
|---|---|---|---|
| Leading | Intro/trial bookings per week | Days | Steer marketing & offers |
| Leading | Second-visit conversion (first-timers who return within 14 days) | 1–2 weeks | Steer onboarding & first-class experience |
| Leading | Marginal-slot fill rate (your 3–4 weakest classes) | Weekly | Steer schedule & class mix |
| Leading | Waitlist depth on popular slots | Days | Steer capacity decisions |
| Lagging | 90-day member retention | Months | Confirm onboarding is working |
| Lagging | MRR / active membership revenue | 1–3 months | Confirm the whole system |
| Lagging | Revenue per active member | Monthly | Confirm pricing & upsell health |
The insight most studios miss: you should almost never run an experiment against a lagging metric. You experiment on the leading metric that feeds it, then check the lagging metric weeks later to see if the improvement was real and durable. If you try to A/B test something directly against 90-day retention, you'll be waiting a full quarter per test and still won't have the volume to trust the result.
If you haven't already built out the observation layer for these, the breakdown in our studio operations dashboard playbook pairs well with this — that one covers what to display and this one covers what you're allowed to conclude from it.
The uncomfortable math: what "detectable" actually means at low volume
This is the part almost nobody wants to hear. If your studio sees roughly 40–60 new intro bookings a month, most of the experiments you're tempted to run are statistically hopeless. Not because the idea is bad — because you don't have the volume to detect anything smaller than a huge effect.
Eliminate class scheduling chaos.
Yoglyly helps you book, confirm & manage every class seamlessly.
- Centralized class scheduling
- Member notifications
- Instructor and resource management
No credit card required
The concept that governs this is the minimum detectable effect (MDE) — the smallest true change your test can reliably catch given your sample size. Low sample = large MDE. A studio testing two versions of an intro offer with 50 sign-ups a month, split in half, is working with 25 per arm per month. To reliably detect anything below roughly a 15–20 percentage point difference in conversion, you'd need to run that test for months. And in months, everything else changes — season, weather, a new instructor, a competitor's promo — so the test contaminates itself.
-
Under ~30 events per arm over the test window you can only detect very large effects (20%+ swings). Don't run a formal test. Make the change based on judgment and monitor the leading metric.
-
~30–100 events per arm you can detect medium effects (roughly 8–15%). Worth testing high-leverage changes only.
-
Over ~100 events per arm you can start detecting smaller effects (~5%). Rare for a single low-volume studio; more realistic if you pool across locations or across a long window.
The mistake isn't running tests. It's pretending a test happened when the math never supported a conclusion.
Lightweight acceptance criteria: deciding *before* you look at results
The reason experiments turn into arguments is that studios decide what "worked" after seeing the numbers. Governance flips that. You write down the acceptance criteria before the test starts, and you hold yourself to them even when the result is disappointing.
For a low-volume studio, acceptance criteria don't need to be a research paper. They need four things:
-
The one leading metric that decides it. Not three. One. "Second-visit conversion within 14 days." If you can't pick one, you're not ready to test.
-
The expected MDE given your volume. State honestly
"With ~35 first-timers per arm over 6 weeks, we can only detect a change of roughly 12 points or more. Smaller than that, we won't trust."
-
The minimum run length. Tied to hitting your event count, not to a calendar date you picked because it felt round. If you need 6 weeks to accumulate enough first-timers, the test runs 6 weeks — no peeking-and-stopping early.
-
The pre-committed decision. "If B beats A by our MDE or more, we adopt B. If it's inside the noise band, we keep A because it's simpler / cheaper / already built."
If you can't pick one leading metric, postpone the test until you can.
That last rule matters more than people expect. Most studio experiments end inconclusive, not decisive. Having a default — usually "keep the current version if the new one doesn't clearly win" — stops you from adopting complexity based on a coin flip.
A quick checklist to run before greenlighting any test:
-
[ ] Is this experiment attached to a leading metric, not a lagging one?
-
[ ] Have we estimated events-per-arm for the full window?
-
[ ] Given that count, is the detectable effect small enough to be worth it?
-
[ ] Have we written the decision rule before looking at data?
-
[ ] Do we have a default action if the result is inconclusive?
-
[ ] Is anything else changing in this window that would contaminate the read?
If more than one box is unchecked, you're not running an experiment — you're running a vibe.
When formal testing is the wrong tool entirely
There's a strong argument that a large share of low-volume studios should run fewer controlled experiments, not more. If your monthly numbers are small enough that almost nothing is detectable, forcing an A/B structure onto every change just slows you down and produces false confidence.
Formal testing makes sense when:
-
The change is hard or costly to reverse (repricing memberships, restructuring your class package tiers).
-
You have a repeatable, higher-volume touchpoint — email/SMS sequences going to your whole list, or intro offers where you accumulate enough sign-ups over a quarter.
-
The downside of guessing wrong is real money.
Formal testing is a bad idea when:
-
You're tweaking something cheap and reversible (a class title, a room layout, a welcome-desk script). Just make the change, watch the leading metric, and revert if it dips. This is a "monitored change," not an experiment.
-
Your volume can't detect anything under a 20% swing. You'll spend two months to learn nothing.
-
Multiple things are changing at once and you can't isolate the variable.
Who should not do this at all: brand-new studios with three months of data and wild week-to-week swings. You don't have a baseline yet. Spend that period establishing what "normal" looks like — the attendance-forecasting methods for small studios are a better use of your first quarter than any experiment, because they give you the baseline every future test measures against.
The 12-week cadence, tied to rituals you already run
A measurement system that lives in a separate spreadsheet nobody opens is dead on arrival. The only cadence that survives at a small studio is one bolted onto rituals that already happen — the Monday schedule review, the monthly close, the instructor check-in. Governance has to ride on existing habits, not create new meetings.
A 12-week loop built around a weekly operator ritual (call it your Monday 20-minute review) with monthly checkpoints:
Weeks 1–2 — Baseline and design. Pull your leading and lagging numbers for the trailing quarter so you know your normal ranges and week-to-week noise. Pick one experiment. Write its acceptance criteria and expected MDE. Don't launch yet — confirm the volume math supports it.
Weeks 3–8 — Run and observe (no peeking-and-stopping). Launch the single experiment. In your Monday ritual, you're allowed to watch the leading metric for operational reasons (is anything broken?) but you are not allowed to call a winner or stop early. Log the weekly number, note anything unusual (holiday, instructor sub, weather), and move on. Six weeks is usually the floor for accumulating enough events at low volume.
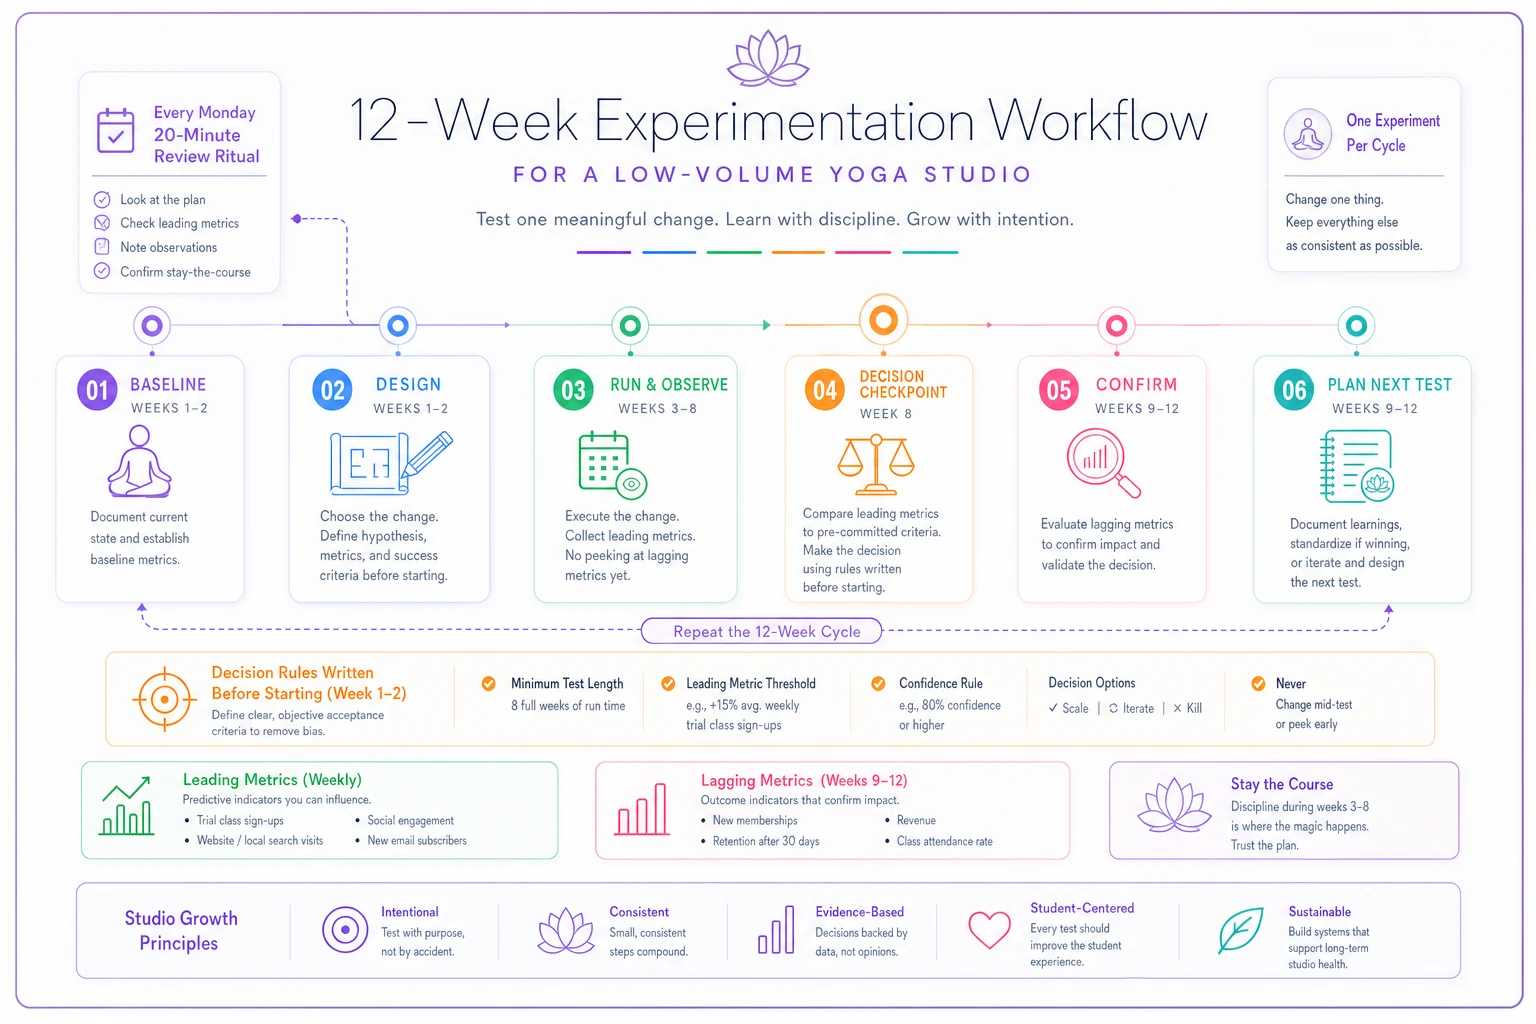
Short visual of this loop helps teams remember the "no peeking" rule and the single-experiment rhythm.
Week 8 — Decision checkpoint. Apply the pre-committed decision rule against the actual event count. Did B clear the MDE? Adopt. Inside the noise band? Keep the default. Write down the decision and why, so future-you doesn't re-litigate it.
Weeks 9–12 — Confirm on the lagging metric + set up the next test. Now watch the lagging metric the experiment was supposed to influence. If second-visit conversion genuinely improved in weeks 3–8, you should start seeing it feed retention and revenue here. If the leading metric moved but the lagging one didn't, that's a signal your leading metric was the wrong proxy — which is itself a valuable finding. Meanwhile, design the next quarter's single test.
The discipline that makes this work is one experiment per 12-week cycle. Low-volume studios that try to run three simultaneous tests end up with contaminated reads and no ability to attribute changes. One clean test per quarter beats four muddy ones every time.
A realistic scenario: the intro-offer test that almost went wrong
A single-location vinyasa studio — around 120 active members, roughly 45–55 intro sign-ups a month — wanted to know whether a "first two weeks unlimited" intro beat their existing "3 classes for $39" offer on second-visit conversion.
Their instinct was to run both offers for two weeks, eyeball the numbers, and pick a winner. Under governance, the math stopped them: two weeks would give roughly 22–25 sign-ups per arm, which could only detect a swing of about 18+ points. Their historical second-visit conversion sat around 40%, and a realistic improvement might be 6–10 points — well below what two weeks could catch.
So they extended the window to six weeks, giving them roughly 65–70 sign-ups per arm, enough to detect a ~10-point difference. Pre-committed rule: adopt the new offer only if it beat the old by 10 points or more; otherwise keep the cheaper-to-fulfill "3 for $39."
Result after six weeks: the unlimited intro converted at about 46% vs. 41% for the class pack — a real-feeling bump, but inside their noise band. Per their own rule, they kept the class pack. The quiet win here isn't a dramatic revenue jump. It's that they didn't roll out a more expensive, harder-to-fulfill offer chasing a 5-point difference that wasn't statistically real. Weeks 9–12 confirmed retention held steady, which told them the class pack wasn't secretly hurting them either.
That's what good governance looks like at low volume: often the correct decision is "no change," and the value is in not being fooled.
Where the system tends to break as you add locations
The single-location version above is manageable in a spreadsheet and a disciplined Monday ritual. It starts falling apart around the second and third location, and the failure points are predictable.
-
Pooled vs. per-location volume. Two locations give you more total events — tempting to pool for statistical power. But if the locations have different demographics or instructors, pooling hides real differences. Governance has to decide upfront whether a test is pooled or per-site, and why.
-
Ritual drift. With one studio, you run the Monday review. With three, each manager runs their own, and within a quarter you have three different definitions of "second-visit conversion" and no shared decision log.
-
Contamination across sites. A promo at one location pulls members from another, wrecking the read on both.
-
The definition problem. "Active member" and "retention" quietly mean different things at each site, so the lagging metrics stop being comparable.
This is the point where the measurement layer needs to live in the same place the operations run — bookings, attendance, and member status flowing into shared, consistently-defined metrics rather than three spreadsheets maintained by three people. Operational platforms that centralize this mostly matter because they enforce one definition of each KPI across the whole business. The math of MDEs doesn't change; what changes is whether all your locations are even measuring the same thing before you compare them. That's less about automation for its own sake and more about removing the definitional chaos that makes multi-site governance collapse.
Measurement governance at a low-volume studio isn't about tracking more metrics or running more tests. It's about respecting your actual volume, separating the numbers you can steer from the ones you can only wait on, and building the decision rules before the data can seduce you.
The studios that get this right run one clean experiment per quarter, tied to a weekly ritual they already keep, on a leading metric they can actually move — and they treat "no meaningful difference, keep the current version" as a completely legitimate, common outcome. The ones that struggle run five underpowered tests, react to every random weekly wiggle, and slowly lose trust in their own numbers. Start with the two-layer KPI map. Be honest about your MDEs. Write your acceptance criteria down in advance. Run the 12-week loop. Do that consistently and you'll spend far less energy arguing about what the numbers mean — because you'll have decided, ahead of time, what you were willing to believe.
Ready to elevate your studio operations?
Join 1,500+ yoga studios using Yoglyly to save time, reduce scheduling conflicts, and enhance member experiences.