

Your yoga studio operations dashboard shouldn't be another spreadsheet graveyard. Most studio owners collect metrics without knowing what to actually do when those numbers change. You check class attendance, track revenue, monitor retention—but then what?
The gap between data collection and operational decisions kills more studios than competition ever could. You end up with colorful charts that tell you things are bad but not why, or what you're supposed to do about it. Meanwhile, operational fires keep burning while you're stuck interpreting spreadsheets.
The fundamental flaw in studio metrics
Studio metrics fail because they're collected in isolation. Your class attendance drops 15% this month. Is that seasonal? Is Tuesday's new instructor driving people away? Did the construction next door mess with parking? Without connecting metrics to specific operational triggers, you're just watching numbers dance.
Most yoga studio operations dashboards track vanity metrics that sound important but don't drive decisions. Total monthly visits looks impressive on a report, but it doesn't tell you if your 6am classes are cannibalizing your evening sessions or if your unlimited members are squeezing out drop-in revenue.
The real operational challenge is how interconnected everything is. A pricing change affects retention. Schedule adjustments impact instructor costs. Marketing campaigns alter class composition. Everything touches everything, yet most dashboards treat each metric like it exists in a vacuum.
Building your prioritized KPI framework
Forget tracking thirty different metrics. You need five core KPIs that actually drive studio decisions, plus clear rules for what happens when each metric moves.
Eliminate class scheduling chaos.
Yoglyly helps you book, confirm & manage every class seamlessly.
- Centralized class scheduling
- Member notifications
- Instructor and resource management
No credit card required
Revenue per square foot per month sits at the top because it forces efficiency thinking. A 1,200 square foot studio generating $18,000 monthly ($15/sq ft) operates very differently than one generating $30,000 ($25/sq ft). This metric exposes whether you're maximizing your physical space or letting prime real estate sit empty.
Decision rule: Below $12/sq ft means you're bleeding money on rent. Between $12–18 means you're surviving but vulnerable. Above $20 means you have real operational leverage. When this drops below $15, immediately audit your schedule density and class sizes.
Member lifetime value to acquisition cost ratio tells you if your marketing math works. Spending $120 to acquire a member who stays four months at $89/month gives you roughly a 3x ratio—barely sustainable once you account for operational costs.
Decision rule: Below 3x means stop all paid marketing immediately. Between 3x–5x means optimize but continue. Above 5x means scale marketing spend more aggressively. Track this weekly during campaign periods, monthly otherwise.
Utilization rate by time slot reveals your actual capacity usage versus theoretical maximum. That beautiful Saturday morning slot with 8 students in a 24-person room? That's 33% utilization burning prime real estate.
Decision rule: Any slot below 40% utilization for two consecutive weeks gets evaluated for cancellation. Below 60% triggers instructor review or format change. Above 80% triggers consideration for adding parallel classes.
Weekly operational review structure
Monday mornings need a 45-minute operational review. Not a staff meeting. Not a planning session. A pure numbers-to-decisions process.
Start with the weekend recap. Studios live and die by weekend performance, yet most owners don't review weekend data until it's buried in monthly reports. Monday review catches problems while they're fresh and fixable.
Pull three specific reports:
-
Weekend class performance versus same weekend last month
-
No-show and late cancel patterns from Thursday through Sunday
-
Instructor coverage gaps or substitution impacts
The sequence matters. Review performance first to set context. No-shows second because they directly impact performance. Instructor issues last because they often explain the first two.
Your decision triggers during this review:
If weekend revenue drops 10% or more versus last month, you implement a recovery protocol by Tuesday—personal outreach to lapsed members, a social media push for the upcoming weekend, and an instructor energy check.
If no-shows exceed 20% of bookings, adjust your cancellation policy communication immediately. Not the policy itself—the communication. Members often don't realize the impact until you show them empty spots that could have gone to waitlisted students.
If substitute instructors consistently correlate with attendance drops over 15%, you need to restructure your sub system. Maybe that means paying regular instructors more to avoid cancellations, or building a smaller, more consistent sub pool.
Here's a simple visual of the Monday review workflow.
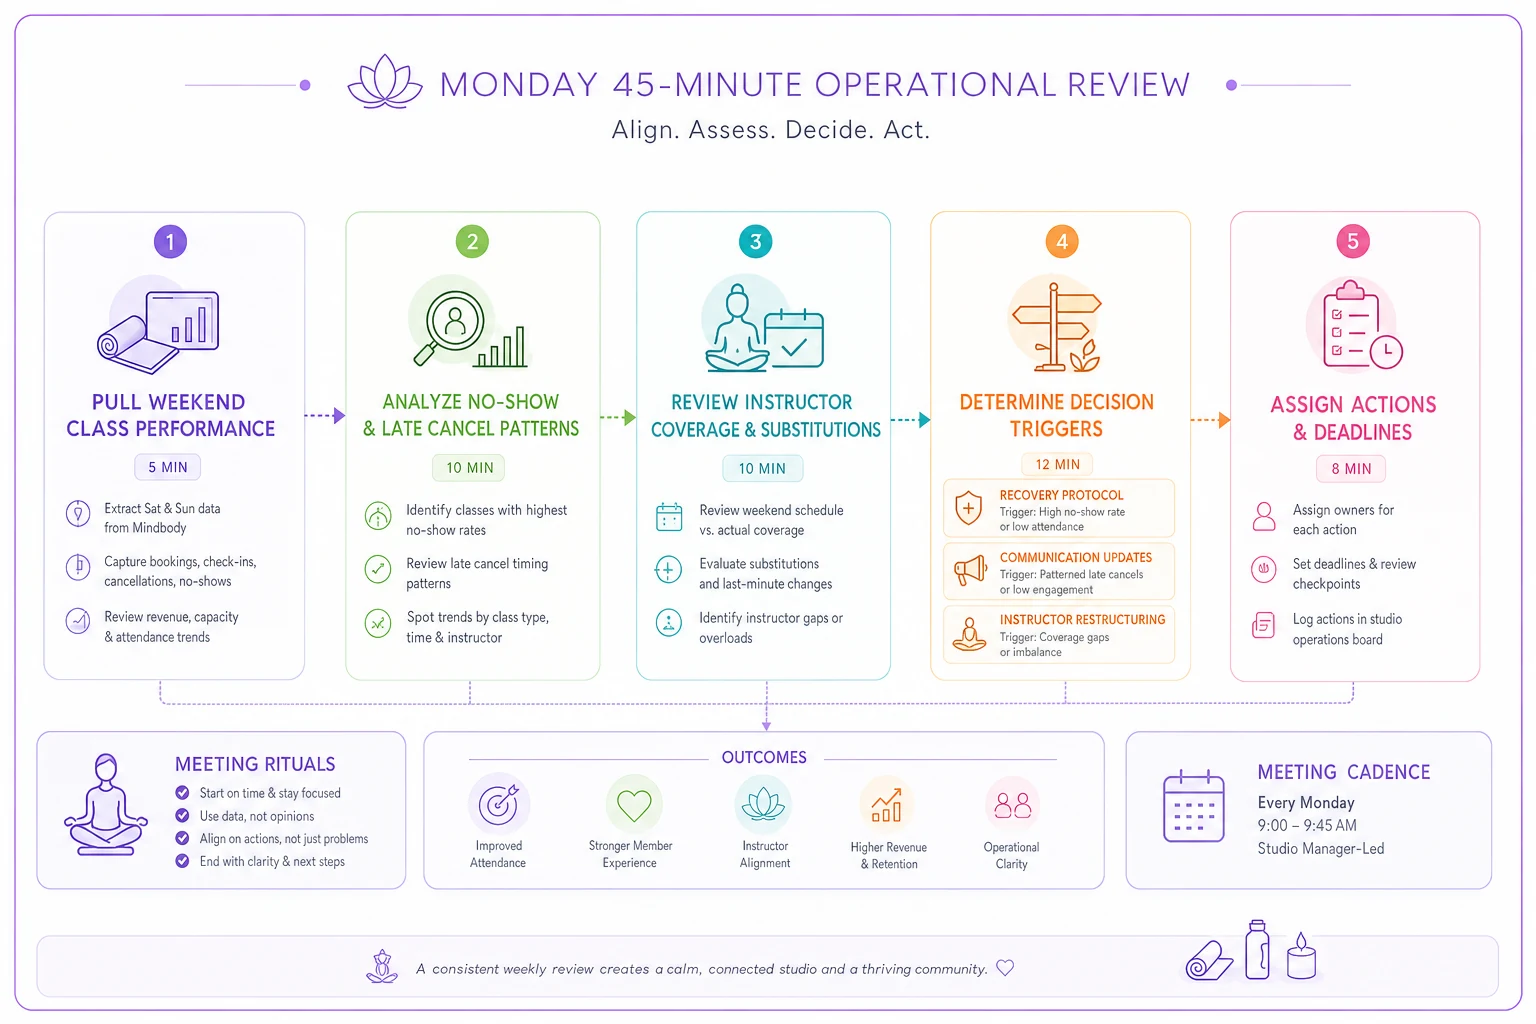
Use the workflow to keep the review focused and action-oriented so decisions happen within 48 hours when triggers appear.
Monthly deep dive structure
Monthly reviews need two full hours, ideally on the first Tuesday. Why Tuesday? Monday's yoga studio operations dashboard gets polluted by weekend data processing delays. Wednesday starts getting too close to mid-month execution.
The monthly review follows a different cadence than weekly check-ins. You're pattern hunting, not firefighting.
Break your review into four 30-minute segments:
Segment 1: Member journey analysis
Track cohort performance, not aggregate metrics. January sign-ups behave differently than September sign-ups. New Year resolution members tend to show very high first-month dropout. Back-to-school September members typically show better six-month retention.
Map each cohort through their first 90 days. When do they drop? After class three or class ten? This tells you whether you have an onboarding problem or a value delivery problem.
Segment 2: Instructor performance correlation
Stop pretending all instructors deliver equal value. Map average class size, member retention, and revenue per class hour for each instructor. The gaps will probably surprise you.
One instructor might average 18 students while another averages 9. That's not just popularity—it's a 2x revenue differential that compounds monthly. The operational question isn't about firing the lower performer, it's about understanding what's driving the gap.
Segment 3: Pricing and package optimization
Review package utilization rates. If unlimited members are attending around 3 classes weekly while paying for "unlimited," you may be leaving money on the table. If 10-class packages expire with several unused classes, you're creating artificial revenue that quietly damages retention.
Your decision matrix: Unlimited members attending less than 4x weekly should be transitioned to class packages. Package buyers consistently using all classes should be upsold to unlimited. It's not about squeezing more revenue per member—it's about matching price to usage patterns.
Segment 4: Operational bottleneck identification
Where does your operation physically break down? Check-in delays when classes exceed 15 students? Parking issues during back-to-back classes? Equipment shortages in popular sessions?
Document every operational friction point with specific triggers. "When evening classes exceed 20 students, check-in extends beyond 5 minutes" gives you a clear constraint to address rather than a vague problem to complain about.
The decision rule matrix
Every metric needs an explicit action trigger. Watching numbers without predetermined responses wastes the entire tracking effort.
| Metric | Red Zone | Yellow Zone | Green Zone | Immediate Action |
|---|---|---|---|---|
| Monthly Revenue | <85% of target | 85–95% of target | >95% of target | Red: Emergency member recall campaign within 48 hours |
| Class Utilization | <40% | 40–65% | >65% | Red: Cancel or reformat within 2 weeks |
| Member Churn | >8% monthly | 5–8% monthly | <5% monthly | Red: Exit interview all cancellations this week |
| Instructor No-Shows | >1 per month | 1 per quarter | 0 | Red: Immediate performance discussion |
| Equipment Issues | >3 per week | 1–3 per week | <1 per week | Red: Order replacements same day |
The matrix eliminates decision paralysis. You don't wonder whether 6% churn is "okay" this month—yellow zone means you implement retention protocols but don't panic. Red zone triggers emergency response.
Dashboard design that drives action
Your yoga studio operations dashboard fails when it shows everything equally. Financial metrics shouldn't sit next to social media followers. Core operations get primary visibility, supporting metrics get secondary placement, vanity metrics get cut entirely.
The main dashboard shows only five tiles:
-
Today's revenue vs. target (refreshed hourly)
-
Week-to-date utilization by time block (morning/afternoon/evening)
-
Current month member count vs. last month
-
Outstanding operational issues count
-
Instructor coverage status for next 7 days
Each tile links to deeper detail, but the main view stays simple. You should understand studio health in under ten seconds, not ten minutes.
Below the main tiles, you need a rolling 7-day trend for each core metric. Not fancy graphs—simple sparklines showing direction. Revenue trending down three days straight? You'll see it immediately without needing to run reports.
Reporting cadence and accountability
Different metrics need different review cycles. Tracking everything daily creates noise. Tracking everything monthly misses critical signals.
Daily monitoring (automated alerts only):
-
Revenue pace vs. same day last week
-
Class cancellations exceeding normal range
-
Instructor confirmations for tomorrow
-
Equipment issue reports
You don't actively review these daily—you set thresholds that trigger notifications. Revenue down 20% versus last Tuesday? You get a text. Three equipment complaints in one day? Immediate alert.
Weekly active review:
-
Full week revenue vs. target and last year
-
Class utilization heat map
-
New member acquisition and first-week attendance
-
Instructor performance variations
-
Operational issue resolution time
Monthly strategic analysis:
-
Cohort retention curves
-
Lifetime value calculations
-
Pricing optimization opportunities
-
Capacity planning for next month
-
Instructor development needs
The cadence prevents both over-reaction to daily noise and under-reaction to developing trends. You catch problems while they're small but don't thrash on normal variations.
Building your implementation template
Start with a simple spreadsheet before investing in complex software. You need to understand your operational rhythm before automating it.
Start with a simple spreadsheet before investing in complex software.
Create five tabs:
-
Daily Scorecard - Simple data entry for key metrics
-
Weekly Review - Formulas pulling from daily data with week-over-week comparisons
-
Monthly Analysis - Automated calculations for complex metrics
-
Decision Log - Record what actions you took based on which metric movements
-
Results Tracking - Document whether those decisions actually improved performance
The decision log becomes your most valuable asset over time. After six months, you'll see patterns—which interventions actually move metrics, which are just operational theater. Maybe your member win-back campaigns consistently fall flat, but schedule adjustments drive immediate utilization improvements. You won't know until you've been tracking it long enough to trust the data.
The coordination challenge at scale
When your studio grows beyond one location or around 500 members, your operational dashboard needs fundamental restructuring. The same metrics that worked at 200 members create noise at 800 members.
Small variations that meant nothing at lower volume become significant at scale. A 2% increase in no-shows at 200 members means maybe 4 empty spots weekly. At 800 members, that's closer to 16 empty spots—potentially an entire class worth of lost revenue.
Decision rules need tighter triggers at scale. That 40% utilization threshold for class cancellation might shift to 50% when you're running 40 classes weekly versus 15. The operational cost of maintaining low-utilization classes compounds faster than the member satisfaction benefit of schedule variety.
Multi-instructor coordination breaks most studio dashboards. When you have twelve instructors versus three, individual performance metrics become less actionable than pattern recognition. Instead of tracking each instructor's exact attendance figures, track deviation from their personal average. An instructor who normally pulls 20 students dropping to 15 matters more operationally than one who consistently draws 10.
Practical realities of studio metrics
The hardest part isn't building the dashboard—it's maintaining discipline when metrics deliver bad news. Your Wednesday evening yoga fundamentals class has run at 30% utilization for three months. The decision rule says cancel it. But it's the owner's friend who teaches it, or it's the class that started the studio years ago.
This is where predetermined decision rules actually save you. The emotional difficulty of canceling an underperforming class gets easier when you've already committed to the action trigger. You're not making the decision in the moment—you're executing a decision you made with a clear head months ago.
Some metrics will genuinely surprise you. Studios often discover their most profitable members aren't unlimited pass holders but 10-class package buyers who purchase consistently every six weeks. They're paying roughly $15 per class versus the unlimited member attending twelve times monthly at closer to $7 per class. Your yoga studio operations dashboard might tell you to focus on package buyers rather than unlimited conversions—which runs counter to what most studios assume.
Seasonality wrecks studio metrics if you don't account for it. Comparing February to January looks like disaster until you remember February has fewer days and follows New Year's resolution month. Your decision rules need seasonal adjustment factors, or you'll constantly overreact to normal patterns.
Technology and automation opportunities
The manual version of this system takes roughly 3 hours weekly between data entry, review, and decision implementation. Manageable, but not sustainable as you scale. This is where AI-powered operational software starts to genuinely change the workflow.
Platforms built for studio operations can pull data from your booking system, payment processor, and instructor schedules automatically. Instead of manually calculating utilization rates, the system monitors thresholds continuously and alerts you when something breaches. When class utilization drops below your trigger point, you get a notification with pre-written communications ready to send—one for the instructor, one for regular attendees, one for your schedule announcement.
The more interesting value comes from pattern recognition. Operational software enhanced with AI automation can surface things like Tuesday morning cancellations spiking whenever it rains, or new members who don't attend their third class within 10 days showing much higher dropout rates. These patterns hide in the data and are nearly impossible to spot manually when you're running a busy studio.
Automated decision documentation also changes things considerably. Instead of maintaining that decision log by hand, the system tracks every metric movement, every triggered action, and every result. After a few months, you get a clearer picture of which interventions actually work versus which just feel productive.
Making it actually work
The best yoga studio operations dashboard means nothing if you don't review it consistently. Block Tuesday mornings for monthly review. Make Monday's weekly review non-negotiable. Set up automated daily alerts so critical metrics can't slip past you unnoticed.
Print your decision rule matrix and put it somewhere visible. When metrics hit triggers, the action isn't optional. The moment you start negotiating with your own rules, the entire system collapses into another ignored spreadsheet.
Share the framework with your team, but think carefully about access levels. Instructors see their own performance metrics and studio-wide utilization. Front desk sees daily operational metrics and member check-in patterns. Ownership sees full financial performance and strategic metrics. Too much transparency creates analysis paralysis—too little creates disengagement.
Review and adjust your decision rules quarterly. That 40% utilization trigger might need to be 35% in summer or 45% in January. Your retention target might shift as your member base matures. The framework stays consistent, but the specific triggers evolve with your business.
The difference between studios that scale and those that stagnate usually isn't passion for yoga or raw business talent. It's the discipline to track the right metrics, connect them to specific decisions, and execute those decisions consistently—even when it's uncomfortable. Your dashboard isn't about pretty graphs or impressive numbers. It's about building a systematic approach to operational decisions that removes emotion and keeps focus on sustainable growth.
Start with the five core KPIs. Build the weekly review habit. Add complexity only after the basics become automatic. The studios thriving in competitive markets aren't necessarily the ones with the best teachers or newest equipment—they're the ones that turned operational chaos into something systematic and repeatable.
Ready to elevate your studio operations?
Join 1,500+ yoga studios using Yoglyly to save time, reduce scheduling conflicts, and enhance member experiences.